
Detect Root Openings During Laser Welding
Faster processing speeds, smaller heat affected zones, shortened cooling cycles, and higher quality make laser welding an attractive alternative to traditional welding processes such as arc and resistance spot welding. However, the highly focused and narrow beam requires precise workpiece fit-up, improved edge preparation, and accurate alignment with the joint line to produce high quality welds. Minor variability in the laser welding process can have deleterious effects on weld quality. The increased throughput that laser welding offers along with its need for tighter tolerances requires process monitoring that catches errors as they occur in real-time, rather than reacting to flaws downstream. This article demonstrates InnerVoice's ability to detect root openings during autogenous laser welding.
A manufacturer was experiencing part fit-up variability that resulted in a weld bead discontinuity flaw during an approximately 12-second circumferential laser weld. The welding process was instrumented with Manufacturing Behavioral Science's Single-Point Optical Sensor. This non-invasive visible light optical sensor captures the high frequency and large amplitude fluctuations emitted from the laser welding process. The wide dynamic range of the sensor makes it ideal for high energy density processes like laser and electron beam welding.
Production data were collected over a 24-hour period. Nearly 750 laser welds were made. The data was organized into a "Qualification" project and a "Production" project. Twenty-three welds were inspected and met the manufacturer's quality requirements and production specifications as per the approved welding procedure specification (WPS). The data for these welds were stored in the "Qualification" project, while the "Production" project contained the remaining 718 welds. During a routine post-process visual inspection, the manufacturer discovered two parts that contained a weld bead discontinuity. The parts were isolated, and the data from these welds were moved to a "Discontinuities" project.
The screenshot below illustrates the drop in the optical intensity for the two parts. This drop in the optical intensity was found to be correlated to the weld bead discontinuities. It is hypothesized that the drop in optical intensity occurred due to an excessively large root opening which stemmed from poor part fit-up.

Using InnerVoice's visualization capabilities, the weld bead discontinuities have been correlated to a drop in the optical intensity over a (nominal) one-second window. Additional parts with optical dropouts were discovered, but they occurred over a shorter time frame which did not materialize in a discontinuity flaw according to the manufacturer's specifications. The manufacturer therefore determined a time interval of approximately one second or more was cause for process-based intervention.
Based on this information, InnerVoice was configured and trained to learn the process behavior for the 23 "Qualification" welds using an "Optical Profile Feature Generator" and a "Control Limit Baseline Generator" [1]. For the purposes of this demonstration, comparing the parts from the "Discontinuities" and "Production" projects provides a means of verifying and validating InnerVoice's data analytic classification capabilities meet the manufacturer's needs. The two flawed welds from the "Discontinuities" project will be evaluated first.
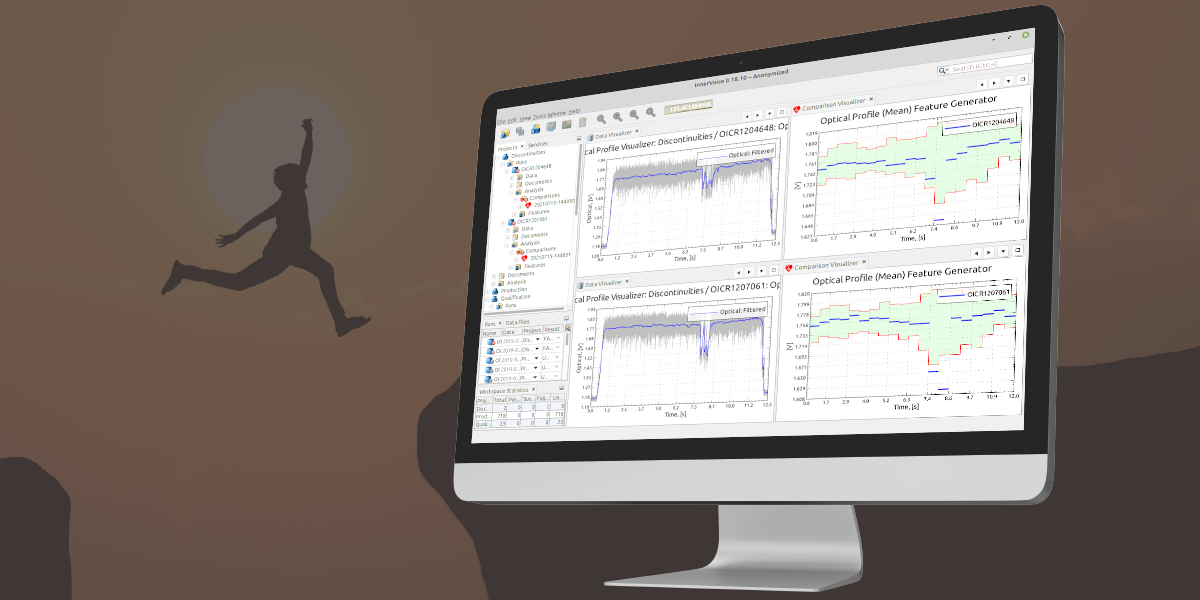
The screenshot below illustrates the results from the "Control Limit Baseline Comparison" for the two welds contained in the "Discontinuities" project.

Notice the two segments in the two comparison views that are located between seven and nine seconds which fall well below the lower control limit boundary. Both parts failed the comparison test and are labeled appropriately by the quality badge that is superimposed on the run icons and comparison folder icons. Finally, the classification results are also summarized in the "Workspace Statistics" window which is located in this demonstration in the bottom left-hand corner.
The process was repeated for the "Production" project. The comparison results from the "Production" project yielded 68 out of 718 welds as "failed". The manufacturer reviewed the "failed" comparisons and set aside two components with similar process dynamics as the weld bead discontinuities. These parts received additional "inspect for cause" scrutiny through post-process visual inspection. The parts were later deemed acceptable for service. The process data and comparisons are illustrated in the following screenshot.

The remaining "failed" comparisons were reviewed and determined to be borderline acceptable in terms of the process data. It was therefore decided by the manufacturer that the control limits were unnecessarily tight for their quality requirements. Consequently, the control limits were expanded slightly to reduce the false positive rate. The comparison process was re-run on both the "Discontinuities" and "Production" projects.
The comparison results from this second iteration resulted in the two known flawed welds from the "Discontinuities" project being flagged as "failed", while only one weld out of 718 in the "Production" project being flagged as "failed". Once again, the manufacturer reviewed the process dynamics from the production part. The process dynamics indicated a slight delay in the laser initiation at the start of the process which resulted in a lower than normal optical intensity. The part was pulled for additional post-process visual inspection and was deemed acceptable according to the manufacturer's quality requirements.
In summary, the second iteration of the comparison results caught the two welds of concern and yielded a false positive rate of 0.1%. This demonstration presented an InnerVoice solution that addresses a single production quality concern, that is a root opening that resulted in a weld bead discontinuity flaw. The focus of this document was purposefully narrow in scope to demonstrate the capabilities of InnerVoice.
A more complete solution may include additional feature generators that capture other aspects of the optical feedback, such as the short, high-frequency transients in the optical signal. Broadly speaking, changes in these high-frequency transients may indicate a change in the heat source to material coupling or process stability. Causes for this may include workpiece surface contamination, seam misalignment, keyhole instabilities, or excessive spatter.
Contact us for more information about how InnerVoice can solve your manufacturing process monitoring needs.
--
[1] InnerVoice evaluates process performance and establishes part-to-part process consistency and repeatability by comparing the features from a weld to a baseline. The baseline includes parts of known weld quality that were established through post-process destructive and non-destructive evaluation techniques as per the manufacturer's approved WPS. In a typical production environment, the part being compared to the baseline represents a weld of unknown quality where process behavior is used to evaluate process consistency and repeatability with respect to the baseline.